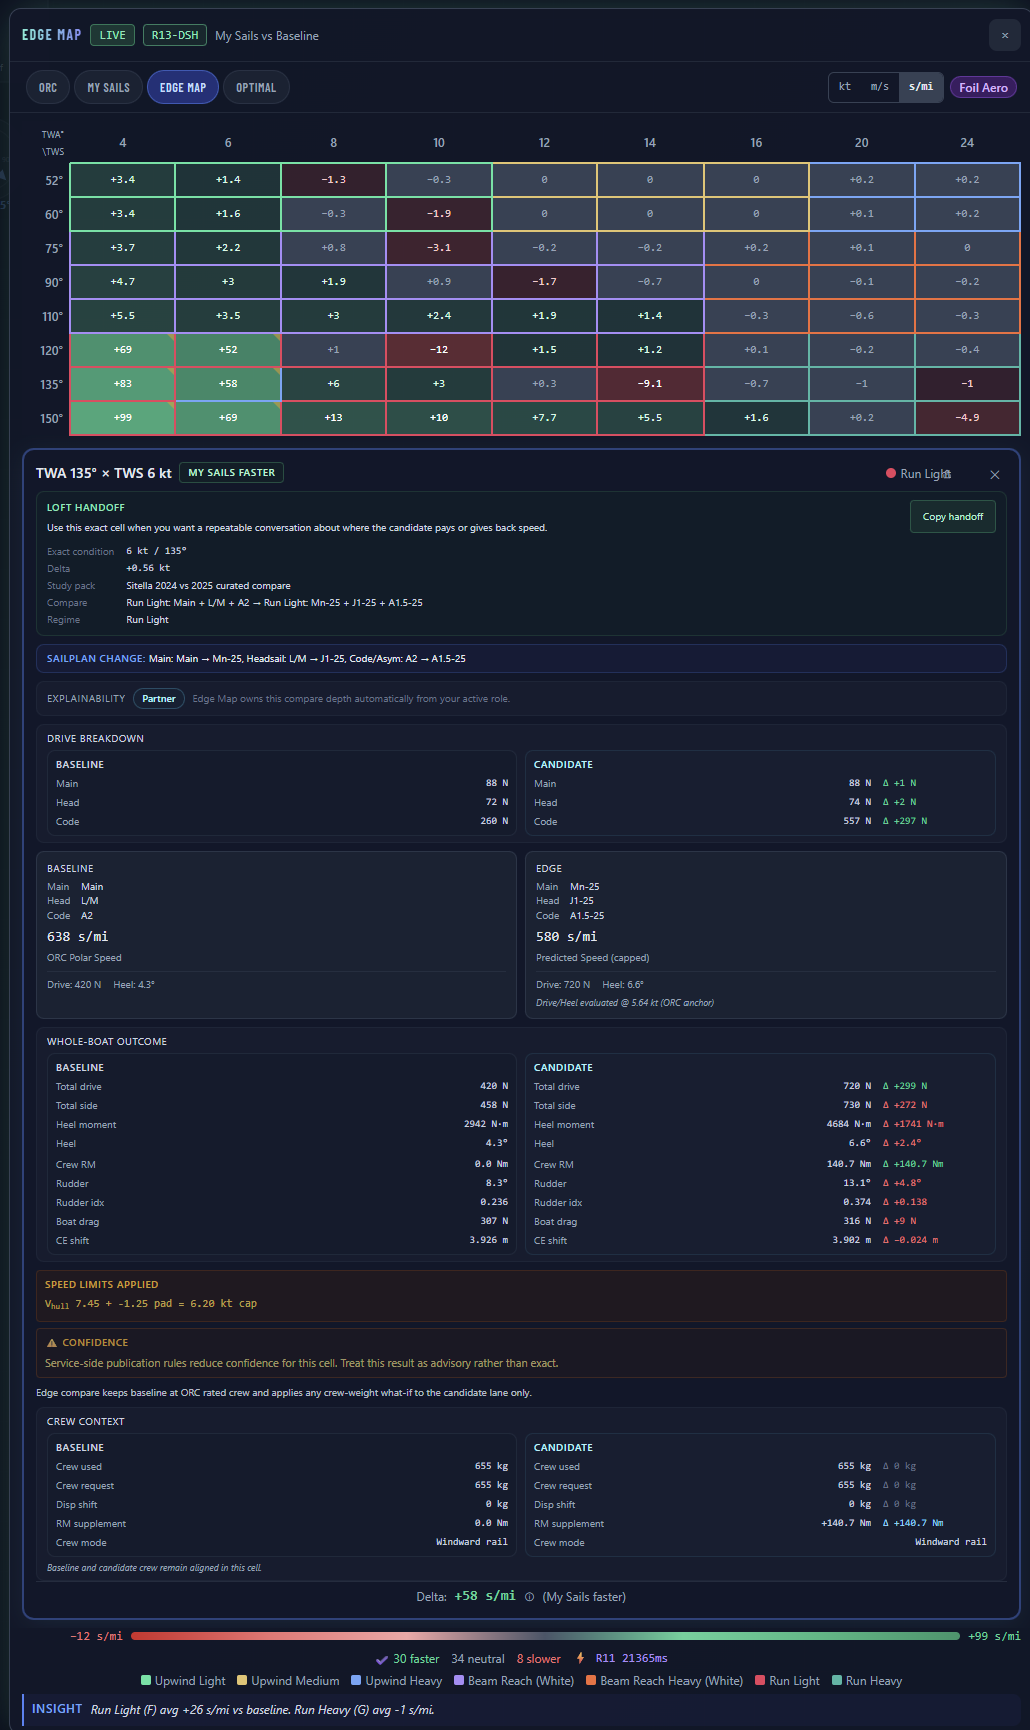
The SailEdge™ by SailrScience Edge Map doesn’t hand you a number and ask you to trust it.
Tap any cell and see everything behind the delta — which sail drives it,
what the whole boat paid for it, how confident the model is, and what physics
produced it.
Nothing is a black box. One cell, three depths — start at
Anatomy of an Edge and follow
the same cell down.
Which sail drove itMain, headsail, or code sail. Force decomposed per sail.
What the whole boat paid for itHeel, rudder demand, drag, wave lane status, and balance shift — not just the raw sail force.
What changed between baseline and edgeThe delta, attributed. Not just the number — the reason.
Per-Sail Attribution
Which sail made the difference?
Every cell (one intersection of the wind matrix — one true wind angle, one true wind speed, one sail combination evaluated against the ORC polar) in the Edge Map (the performance delta grid — every sail measured against your boat’s ORC polar at every wind speed and angle) is a speed delta. But a delta has parts.
The drive breakdown shows you how much each sail contributes —
main, headsail, and code sail — independently.
Tap a cell and the model shows drive force per sail: how much forward push
each produces, how much side force and heel it creates, and what that means
for the combined picture. The panel now also carries a whole-boat outcome read:
when a code sail adds drive but gives the gain back through heel, rudder demand,
drag, wave lane behavior, or balance shift, you see that too.
Negative drive detection matters here. If a sail is producing drag instead
of drive at a given angle, the breakdown flags it explicitly. No hidden
penalties — every force is on the table.
Confidence
The model tells you when it’s sure — and when it’s not.
Not every cell carries the same confidence. When the physics approach a
boundary condition — publication fencing limiting the published gain,
a baseline sail plan that’s underpowered for the angle, missing approved
wave input, or high rudder demand eating into the delta — the Edge Map
tells you.
Amber-tinted cells mean the delta is real but boundary-limited. The amber
intensity scales with severity: a light tint means a minor constraint is
active, a strong tint means multiple boundaries are compressing the result.
Each amber cell includes a plain-language attribution — not just
“low confidence” but specifically which boundary triggered it.
This isn’t hedging. It’s transparency. A +0.4 kt delta with no
amber is a cleaner result than a +0.4 kt delta with three active constraints.
The Edge Map lets you tell the difference.
Sanity Checks
Every advisory annotates the cell. The map stays complete.
Some cells deserve context with their number. When a configuration sails outside
a sail’s effective wind range — a reaching kite at an angle where it
would produce drag instead of drive — the cell carries a typed advisory
naming the condition. The comparison still solves, the computed delta still
shows, and the advisory tells you to read that cell as a what-if.
No false positives. No phantom gains. Every number arrives with the context
that keeps it honest.
The Aero Model
Not a lookup table. A physics model.
The deltas in the Edge Map come from a per-sail aerodynamic model that
computes lift, drag, drive, and heel for each sail independently —
then combines them with hull resistance, heel equilibrium, and rudder
correction to produce a boat speed.
Modern planforms credited. The model distinguishes sail shapes:
a squaretop main gets different planform treatment than a pinhead, because the
area distribution aloft changes both the lift curve and the center of effort (where the aerodynamic force effectively acts — modeled per sail from its planform geometry, trim state and wind condition).
Square-top and high-roach designs are recognized and credited for the geometry
they actually have.
Material and shape metadata. When sailmaker-provided aero
metadata is available — cloth family, construction method, shape retention
characteristics — the model uses it. When it isn’t, conservative
defaults apply. Either way, the model is transparent about what it’s
working with.
Sail interaction. When the
mainsail shadows the headsail at deep angles, the model reduces headsail
effectiveness where the physics demands it. Combined configurations —
staysail under an asymmetric, for example — are modeled together, not
sail-by-sail. Transitions between upwind and
downwind modes are continuous — no checkerboard artifacts from hard
regime switches.
Regime blending. As the wind angle sweeps from upwind through
reaching to downwind, the aerodynamic character of each sail changes. The model
blends coefficients smoothly across regimes rather than switching abruptly at
a fixed angle.
The methodology pages go deeper. This section tells you what
the model considers. The methodology tells you how.
For Partners
Expert Mode — for those who want the full readout.
Partners and advanced users get a deeper diagnostic layer. Expert Mode (the professional tier’s deeper readout of the same solved physics — never a better answer) exposes
the decoded confidence attribution behind every amber cell, composite
center-of-effort tracking across the full sail plan, whole-boat outcome,
wave-lane disclosure, and per-sail aerodynamic diagnostics that go beyond
drive and heel.
This is the layer where sailmakers validate model behavior against their own
design intuition — and where SailrScience refines the model based on
real-world feedback under NDA.
Change the crew weight and every cell in the Edge Map recomputes. The delta
isn’t a single number — it’s a per-cell RM supplement that shows how much
righting moment changed, and a crew mode label (Windward Rail, Blended,
Centerline Low) that shows where the crew sits at each wind angle.
Lighter crew gains on reaches where less displacement helps, but pays upwind
where less righting moment limits drive. Heavier crew reverses the story —
more RM on the rail means more stability (the boat’s righting behavior — rated on the certificate, then computed by the R16 stability layer for each sailing state) in medium and heavy upwind air.
The Edge Map shows both sides.
This is the subscriber tier (the tier a SailEdge license unlocks — your own certificate and the physics it earns) — every subscriber sees it. No Expert Mode required.
Hull Stability Profile. A Delft-style RM stability profile captures the
difference between form-stabilized and ballast-stabilized hulls. Form hulls are stiffer
at low heel but need more righting moment help at high heel. The profile shapes the
stability response per hull family, making the published heel more truthful across the full wind range.
Learn more →
Every cell result can be reproduced. Same ORC certificate, same sail inventory,
same wind condition — same output. The model doesn’t drift between
sessions or change behavior silently. If a number changed, something you can
point to changed. That’s not a feature. That’s the contract.
How to read an Edge Map
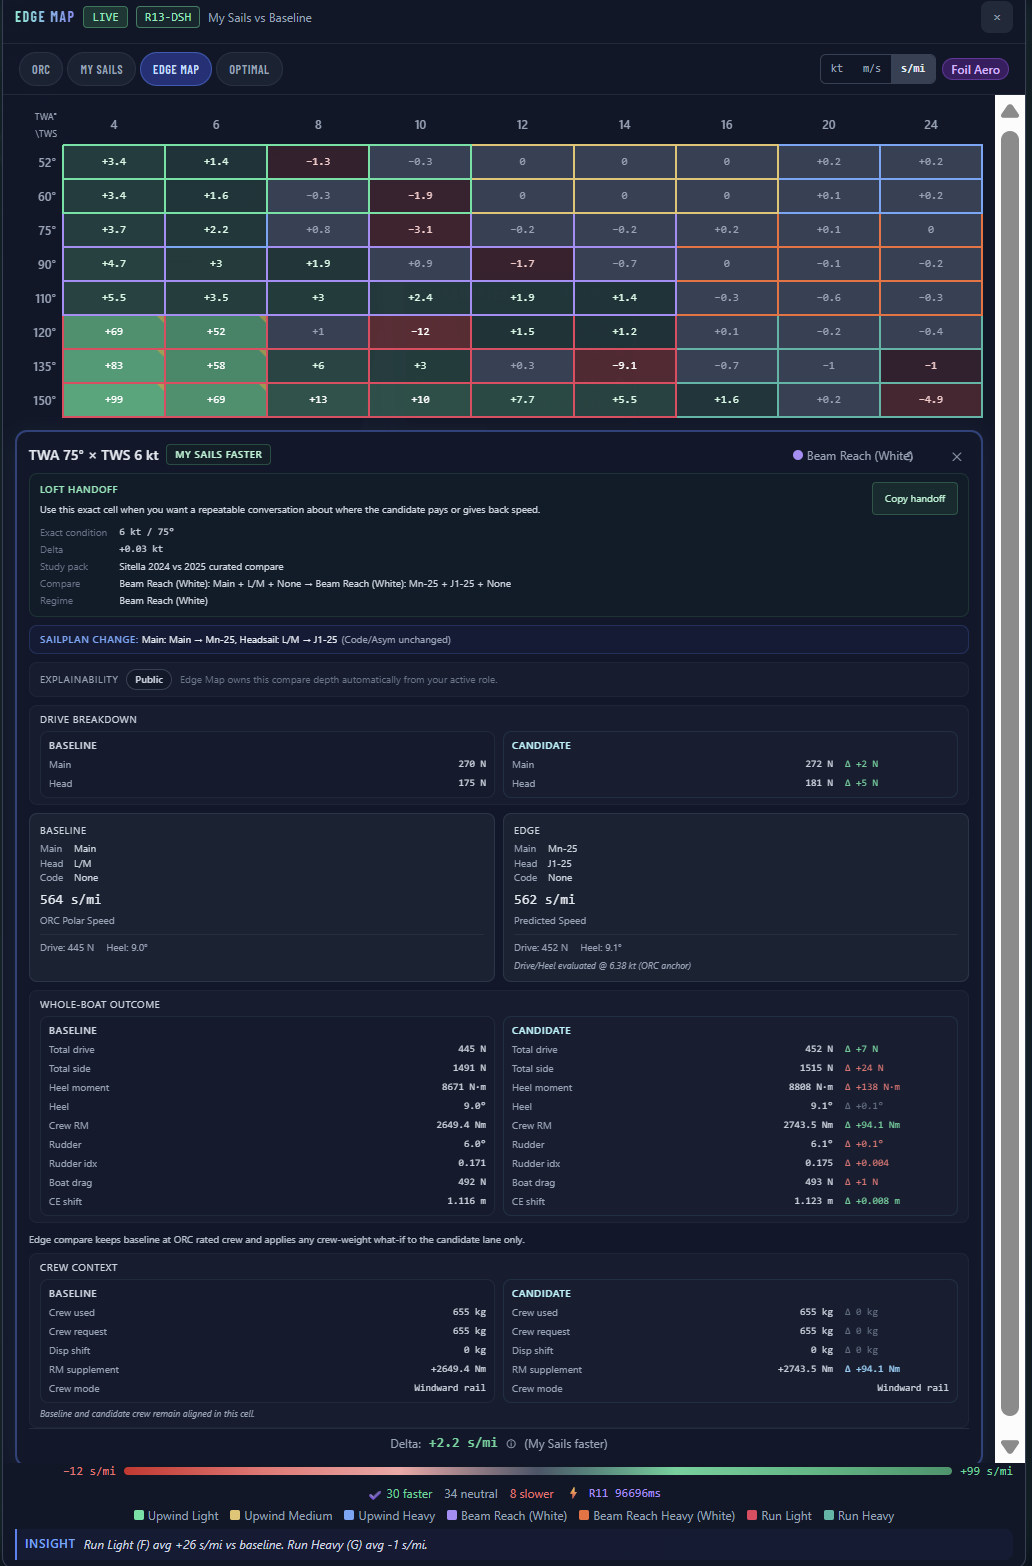
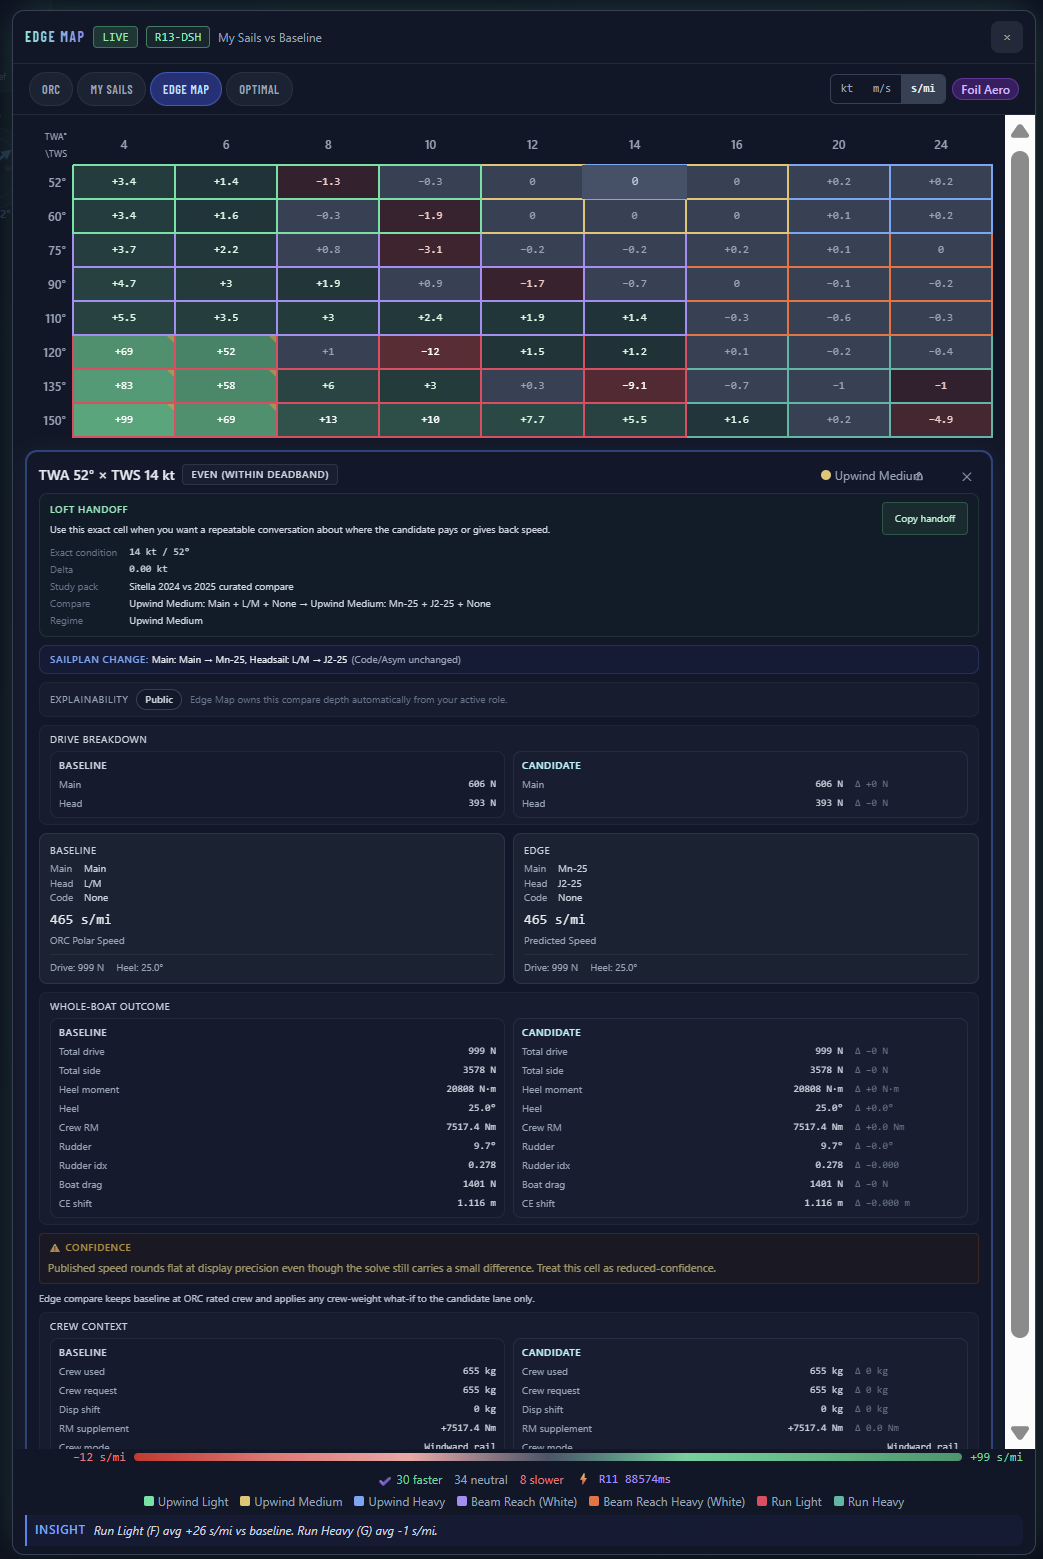
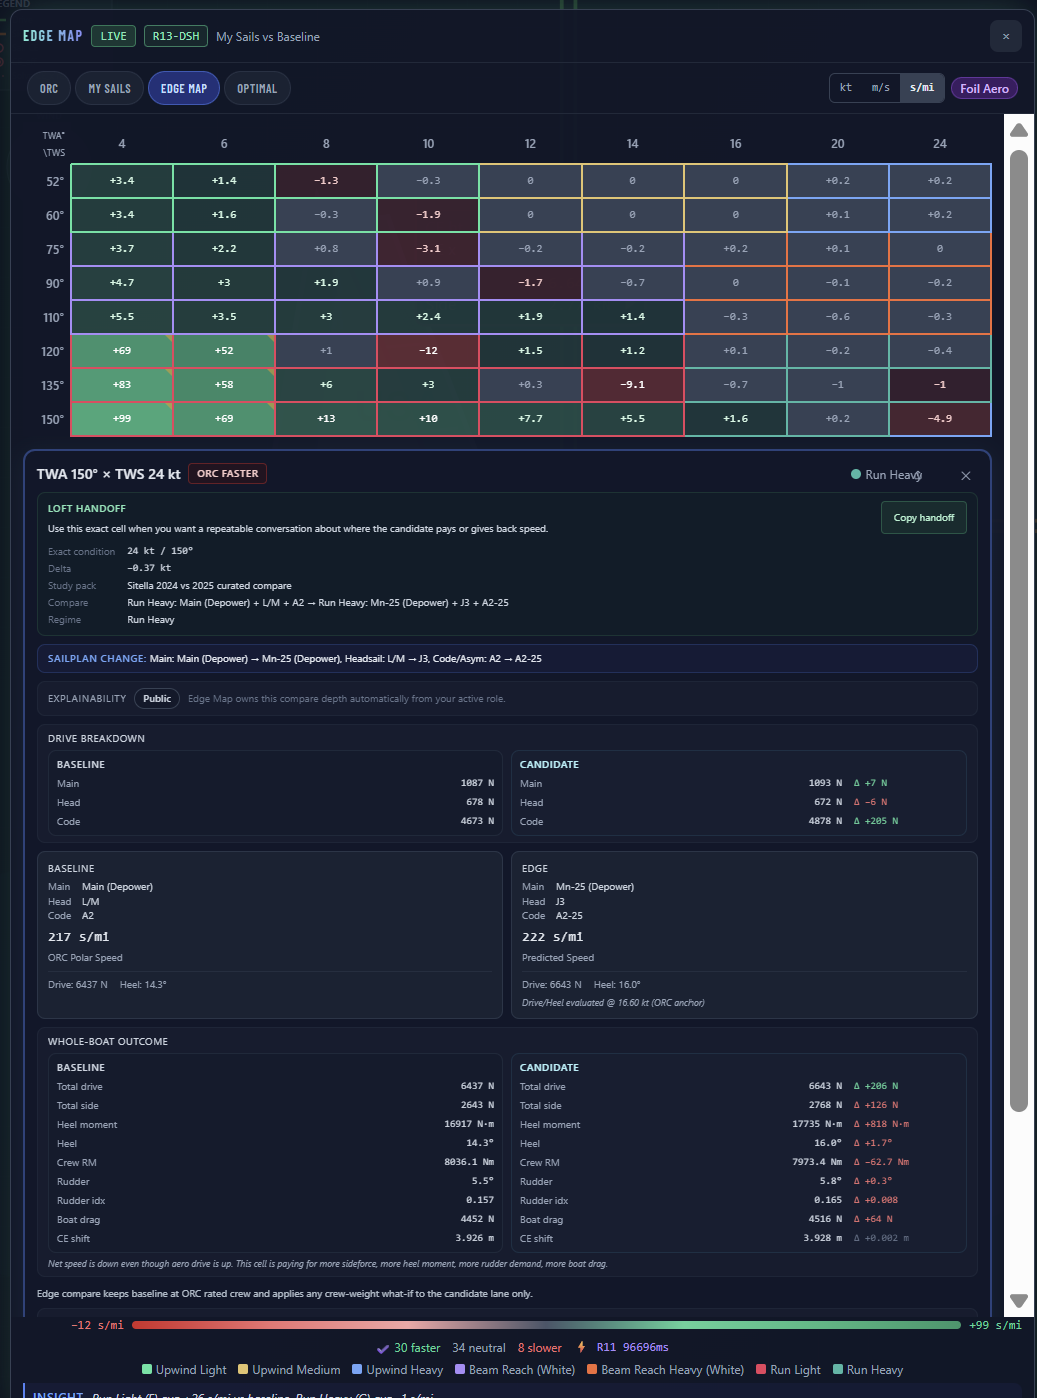
1. Scan for green clusters. Those are the wind angles and speeds where the edge sail delivers measurable gains. 2. Read the regime averages. The insight bar distills each wind regime into a single delta — the quickest way to judge an inventory change. 3. Tap pivotal cells. Open the force breakdown and whole-boat outcome to see why the delta exists — more drive, more drag, more rudder, a wave-lane limit, or a shift in CE balance. 4. Check the honesty cues. An amber corner marks a boundary-limited cell — the delta is real but reduced-confidence. A hatched cell carries an effective-wind-range advisory: a sail is below its kind’s wind-angle floor there. The comparison still solves and the number still shows — the advisory tells you to read that cell as a what-if.
Tap any cell. Expert view — the verdict up front, then loft handoff, drive breakdown, whole-boat outcome, honest limit disclosures, and crew context — in seconds per mile.
The Verdict, Up Front
Every cell answers the same question three ways.
The badge at the top of every cell detail is the cell’s verdict, computed from
the wire delta against one shared tolerance band — the same band that colors
the grid. Faster is green. Slower is red. Inside the tolerance, the honest
answer is even, and the badge says so instead of manufacturing a winner.
My Sails faster. A white-sail swap pays 2.2 seconds per mile at 75° / 6 kt — small, real, and stated in the unit a race is actually lost in.Even (within deadband). At 52° / 14 kt the two plans solve to the same published speed — the badge refuses to invent a winner, and the confidence note says why.ORC faster. Running heavy at 150° / 24 kt the candidate gives speed back — and the whole-boat outcome shows where it went: side force, heel moment, rudder.