The crossover chart
you tape to the coaming.
Every racing sailor knows the crossover chart. The Optimal Map from SailEdge™ by SailrScience is that chart, computed from your ORC certificate — the winner your boat can actually hold at every wind speed and angle, with the physics to show why.
Explore Your Edge See the Edge Map →The Chart
You already know this chart. This one is computed.
A crossover chart is only as good as what stands behind it. Yours is solved from your ORC certificate and your rated sail inventory — every plan your certificate rates competes, each solved with its own physics fingerprint at every wind speed and angle, nothing pre-filtered by assumption — symmetric kites rank on their merits. Up to 18.4 million physics evaluations (one full aero and hydro force-balance solve at one point of the wind envelope), depending on the size of your wardrobe, and every response carries its own server timing. Every cell (one intersection of the wind matrix — one true wind angle, one true wind speed, one sail combination evaluated against the ORC polar) is solved to equilibrium and gated by feasibility before anything is ranked, so the chart reads the way a crew actually sails: the right sail, the honest margin, and the exact crossover points between them.
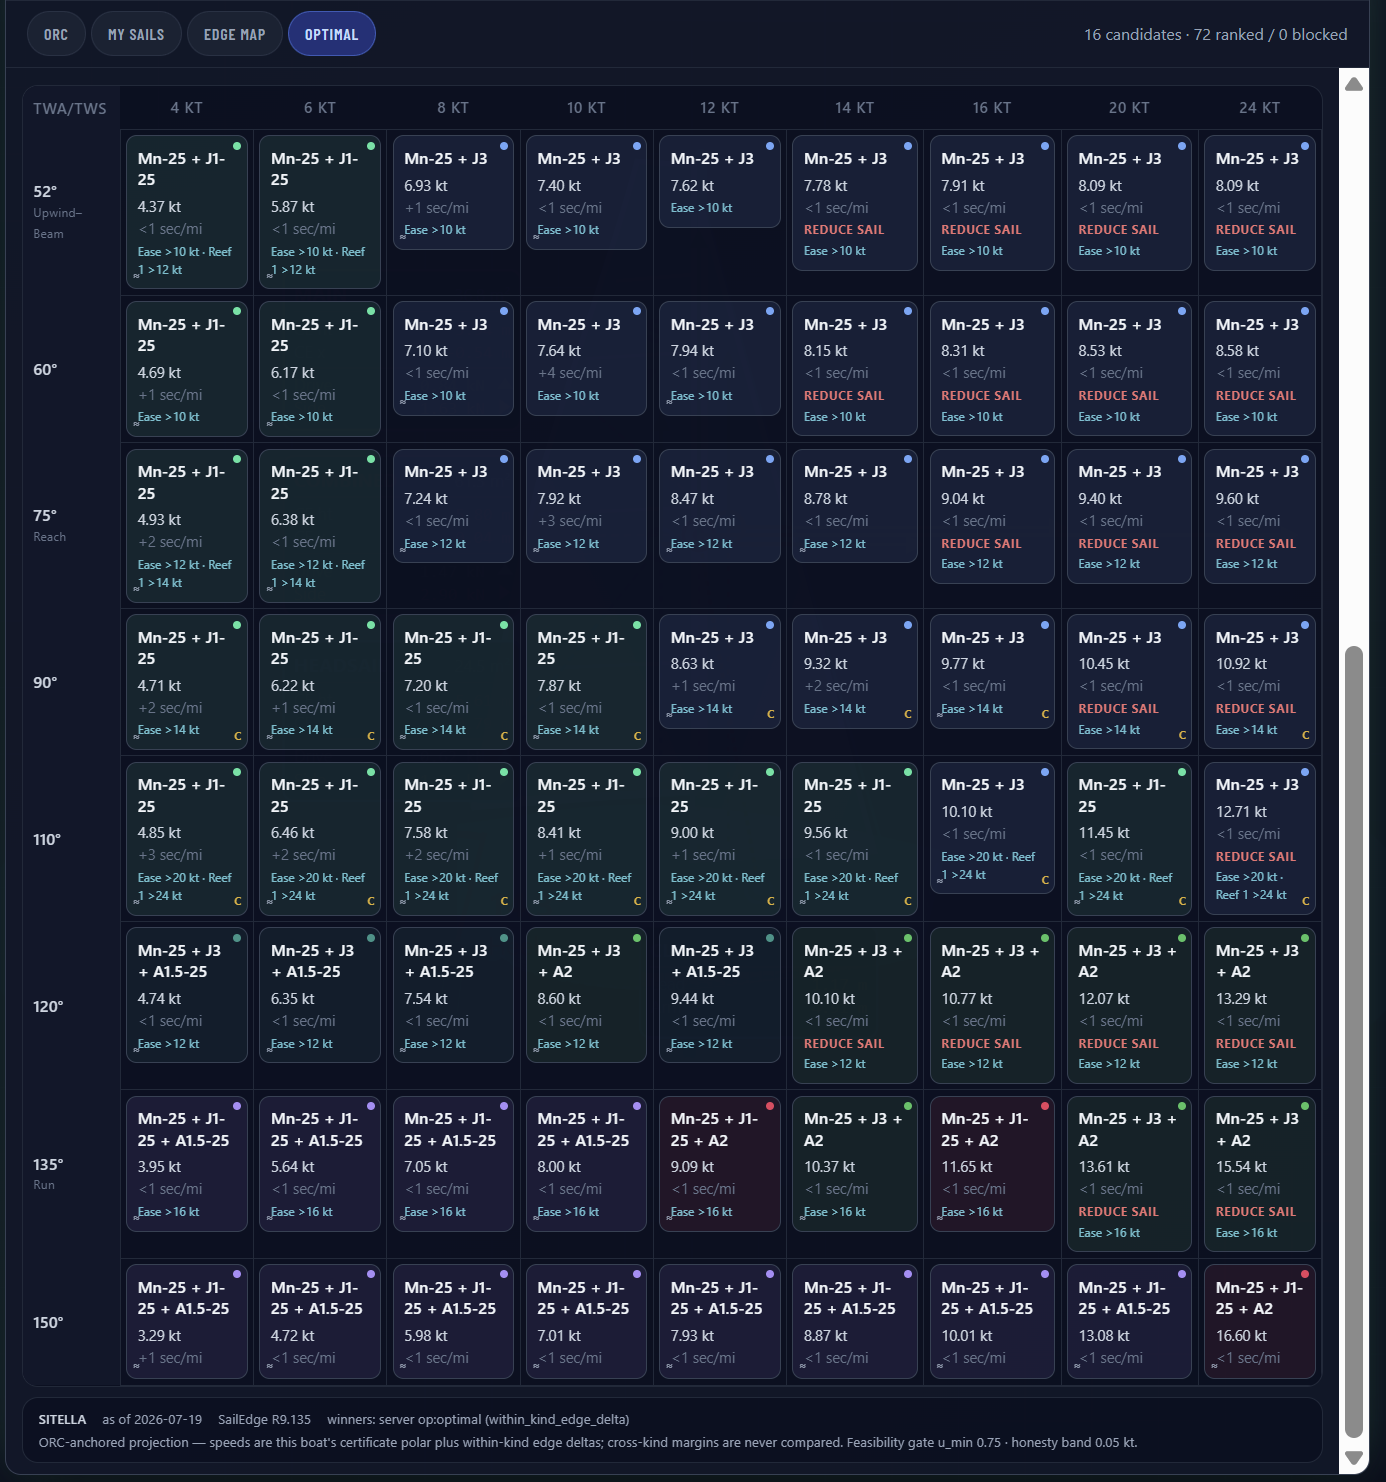
You decide who competes. Mark a sail out of contention in your inventory and the map solves without it — excluded at the source and disclosed on the chart: “Excluded by you.” Only your declared primary main can’t be benched; it always competes, and the chart discloses when it kept it in.
The Edge Map (the performance delta grid — every sail measured against your boat’s ORC polar at every wind speed and angle) answers a purchase decision you make once a season; the Optimal Map answers the race-day call you make ten times a regatta — which sail, and exactly when to change. The stakes are concrete: in the A1.5-vs-A2 sail study, at 4 knots and 110 degrees the light-air kite holds a 1.80-knot edge — 438 seconds per mile. In a dying breeze the wrong kite isn’t a nuance; it’s the race.
The Feasibility Gate
Fast on paper isn’t fast on the water
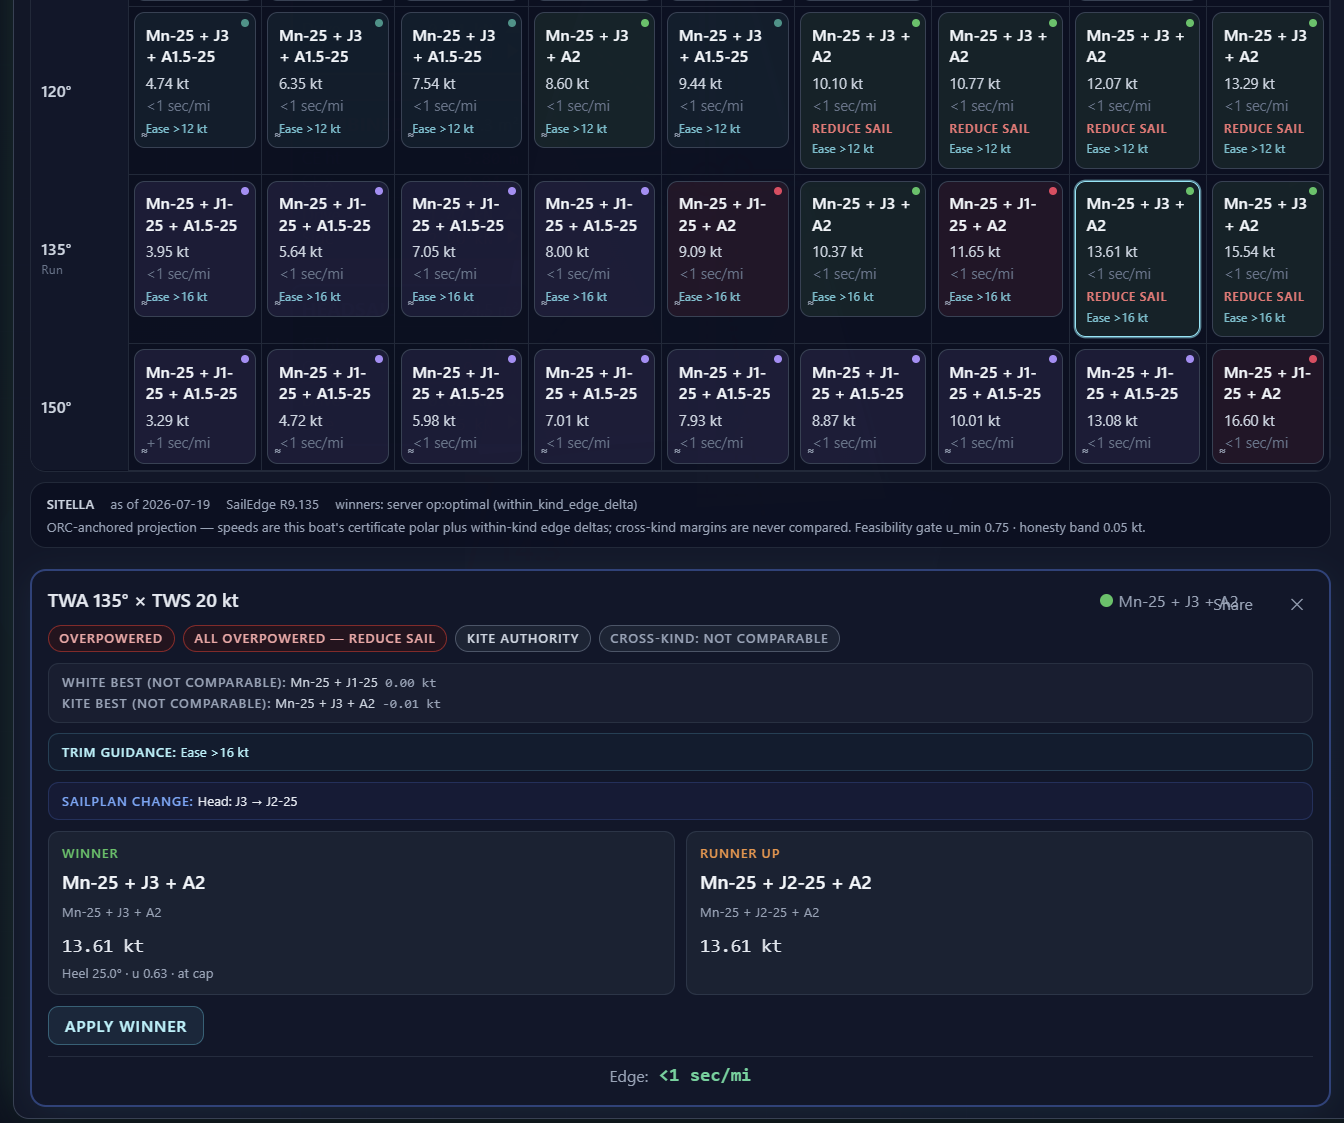
A big kite at a tight angle can post a huge projected number — while the boat it overpowers is rounding up in the puffs. Most crossover tools rank raw numbers. The Optimal Map ranks what the boat can hold.
Every candidate plan is solved to physical equilibrium at every cell and classified: free — the boat carries it with margin in hand; powered — the crew is working, the plan holds; overpowered — depower has run out of range. An overpowered plan never ranks. No matter its projected speed.
And when every plan in the wardrobe is overpowered at a cell, the chart doesn’t invent a winner — it reads REDUCE SAIL, exactly the call your bowman was about to make.
The winning sail is the one you can actually fly.
Honest Margins
When it’s close, the chart says so. When to ease, it says that too.
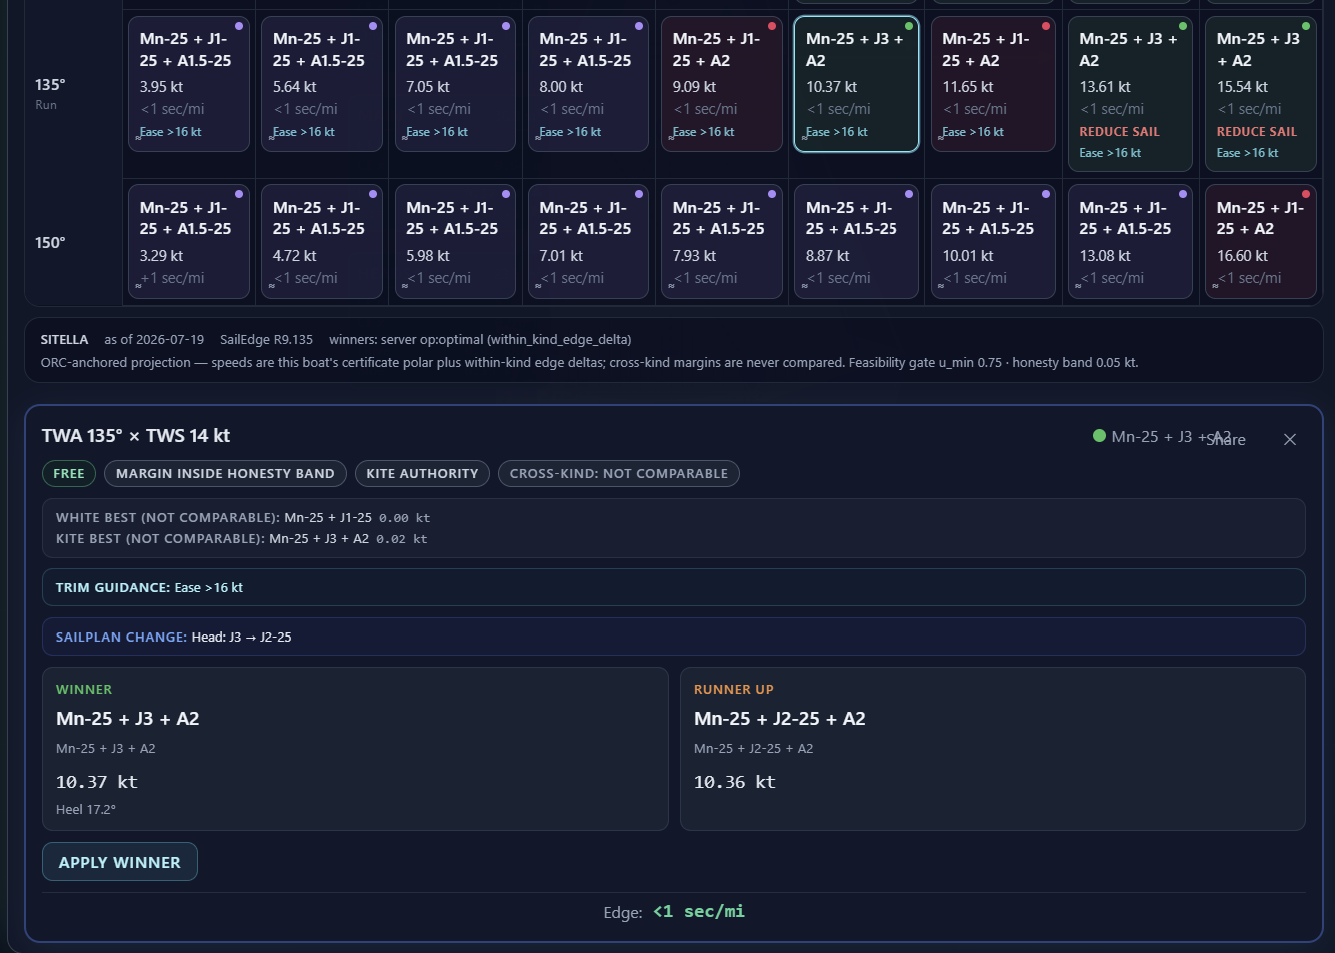
Where the physics says two plans are genuinely even, cells inside the honesty band read ≈ instead of pretending to a decimal-point verdict — a real tie, disclosed, with handling economics like sail changes and pole work breaking the tie only when speed can’t.
Ranking sails and coaching trim are different jobs, and the chart keeps them honest by keeping them separate. Each wind angle carries its own thresholds, derived from the same physics that ranked the sails: Ease above the wind speed where the plan first leaves free sailing, and Reef 1 above the wind speed where reefing is what keeps the plan on its feet. Computed per boat, per certificate — not a rule of thumb. And a reefed main never competes against a full one in the rankings — that would be the tool optimizing your trim to win an argument. The chart tells you the sail; the guidance tells you how to keep it flying.
The crossover your crew argues about? It’s computed — and where it’s genuinely close, the chart is honest enough to say so.
Race Prep
The briefing happens before you leave the dock
Wind forecast says 8–12 from the south. Your Optimal Map says start with the reaching kite, switch to the light-air kite at the first downwind mark if wind drops below 10.
Then print it. The chart prints as the artifact it was designed to be — the same grid, the same verdicts, styled for the chart table and the coaming. Where a cell is genuinely contested, the print shows both plans, because the crew on the water deserves the whole truth, not a coin flip dressed as a verdict.
Save it for the season file — every saved chart is reproducible, carrying the exact configuration that produced it. Works on your phone, portrait and landscape. The full grid, on the rail.
Every audience. One grid.
Racers & Teams
Pre-race planning grounded in physics. Your crew knows which sails to fly at every angle and speed — and exactly when to switch.
Sail Makers
Show your client where each sail earns its keep — and where the next purchase fills the biggest gap in their wind envelope.
Naval Architects
A full-wardrobe physics sweep that would take days of manual computation, delivered in seconds — feasibility-classified at every cell. Present the crossover chart to your client.
ORC Leaders
Over 14,000 ORC certificates issued in 2025. Every one could seed an optimal sail plan. The certificate becomes a complete performance analysis.
Your wardrobe. Your wind.
Your winning configuration.
Race prep. Quantified.