Home›
Technology
›
The Physics
The Physics Behind Your Edge
SailEdge™ by SailrScience starts from your ORC certificate and keeps the certified polar as the
baseline anchor. From there, the runtime resolves apparent wind, force balance,
heel, resistance, and depower to explain where each sail comparison gains or gives
up speed. This page explains how those deltas are derived and why they matter.
Explore Your Edge
Read the walkthrough →
Foundation
It Starts with the Certificate
Every SailEdge computation begins with an ORC certificate — your certified
dimensions, rig geometry, sail inventory, displacement, rated stability, and the
complete polar table produced by the official ORC VPP. That polar (the certificate’s polar performance grid — the official ORC speeds at each wind speed and angle that every Edge Map delta is measured against) is the immutable floor. SailEdge never overrides
it, never adjusts it, never second-guesses it.
The certificate defines what the boat can do in ideal conditions with the rated sail plan.
Everything SailEdge adds is built on top of that baseline. Built on ORC, not around it.
Model identity (as of August 2026). SailEdge product line R10 (the DSYHS IGES hull library edition) ·
physics release R16 · hull library: DSYHS — 52 Delft
Systematic Yacht Hull Series reference geometries (IGES-derived), assigned by
certificate best fit and shown for your review · crew righting moment on the
ORC VPP CARM basis (2023 documentation). Product releases and physics releases are
separate tracks.
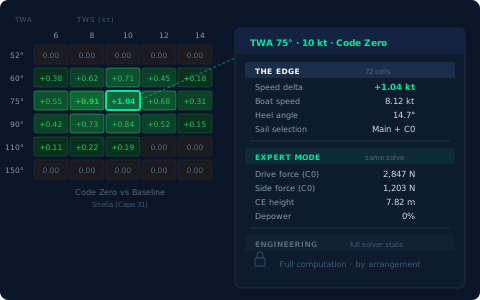
How a delta is stated. Baseline and candidate configurations are
solved by the same R16 runtime. The displayed candidate speed scales the
certificate’s own cell speed (one intersection of the wind matrix — one true wind angle, one true wind speed, one sail combination evaluated against the ORC polar) by the square root of the computed thrust ratio,
bounded and capped against the certified baseline — so the ORC polar stays the
anchor and the result is a differential comparison, not a replacement polar. The full force balance,
including yaw, rudder, and CE/CLR effects, is a SailEdge computation beyond the scope
of the official ORC VPP — a SailEdge output, never an ORC rating or official ORC
speed prediction.
Wind Model
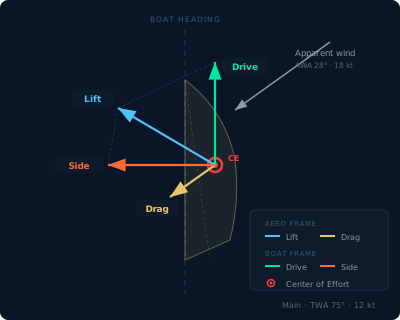
From True Wind to Apparent Wind
ORC reports true wind speed at a 10-meter reference height. SailEdge takes that
true wind vector and converts it to apparent wind at the sail plan — accounting
for boat speed, heel angle, and leeway. The apparent wind speed and angle that
arrive at each sail drive everything downstream: the forces, the loads, the balance.
Get the apparent wind wrong and every downstream delta is wrong with it. This
conversion is the first thing the runtime resolves because both the baseline and
the candidate have to be compared on the same physical footing.
Hydro Forces
The Boat Pushes Back
Aero forces drive the boat forward. Hydrodynamic forces resist that motion. The
R16 runtime uses a boat-integrated DSYHS hull backbone — 52 Delft-series
reference geometries, IGES-derived — grounded in ORC certificate data and
approved boat-carried hydro fields, with bounded follow-on lanes layered on
top — named corrections for the effects calm-water hull physics alone
doesn’t carry.
Upright hull resistance, heel influence, appendage resistance, sideforce/leeway,
rudder interaction, and approved wave resistance are resolved as named hydro lanes
where the boat data supports them.
Your boat’s resistance profile is unique. When a lane is authoritative, the model
uses your boat’s carried data and the live R16 runtime for both sides of the
comparison. When a lane is bounded or waiting on better input, SailEdge discloses
that instead of pretending to know more than it does.
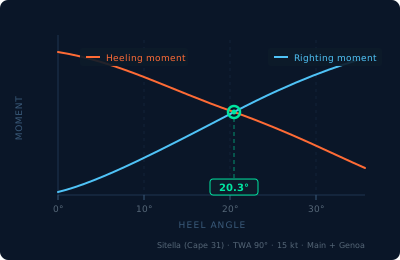
The stability layer in Physics R16 works the way the rest of the engine works:
computed, gated, honest. It derives righting moment and heel behavior at real
sailing angles from your ORC certificate alone, with no hull model or LPP file
in the loop. Every result is published with its confidence grade attached. A
boat outside what the evidence supports gets an explicit refusal and a stated
reason. You always know what a number is worth before you use it.
No evidence, no number.
Under those grades sit the principles ORC publishes for its VPP: righting
moment calculated dynamically, per boat and per rated polar point; a rig that
depowers progressively when over-canvassed; sail changes recognized as the
wind builds. Each stability result now names the sailing state it describes
— naturally balanced, balanced after modeled depower, or balanced after a
modeled sail change from the boat’s own rated sail inventory. And when the
modeled envelope runs out, the engine says so plainly: an informative result,
not a number forced into being.
Every number names its sailing state.
Depower
When the Wind Overpowers the Rig
Real sails don’t hold their designed shape in all conditions. As wind builds past the
sail’s effective range, the crew depowers — and the model does too. SailEdge applies
multiple independent depower effects, each one specific to the sail type and the
condition that triggers it.
Reefing the main is not the same as easing the traveler. Furling a headsail is not the
same as flattening it. Each depower mechanism changes the force profile differently —
reducing drive, reducing heel, or both — and SailEdge tracks each effect separately.
The result is a depower model that behaves the way sails actually behave: progressively,
sail-by-sail, with each mechanism doing its own work.
And every solve carries its verdict. Each equilibrium is classified —
free, powered, or overpowered —
and that classification travels with the result to every surface that consumes it.
On the Optimal Map, an overpowered
plan never ranks: the fastest number on paper doesn’t win if the boat can’t hold it.
Speed
From Force Balance to Boat Speed
Once the runtime resolves equilibrium, the ORC polar remains the certified anchor for
the comparison. SailEdge evaluates how a candidate sailplan behaves relative to that
baseline at the same wind condition, with baseline-anchored speed guardrails, stability
thresholds, and minimum-drive requirements keeping the comparison inside a qualified envelope.
Baseline stays untouched as the reference. Candidate upside is published only inside
the allowed compare fence, and any blocked or unstable condition is reported as such
instead of being passed off as a replacement certified speed. Every limit is attributed
so you can see what bounded the answer and why.
The certificate is the contract. SailEdge publishes directional deltas from that
contract, not official ORC speed changes.
Where This Leads
From your certificate to the fleet’s vocabulary.
A performance archetype is one of the fleet’s eight recurring design types.
Physics establishes each one: how the hull, rig, and sailplan create speed, where that speed pays, and the trim precision it takes to collect.
Every archetype claim in the portfolio traces one unbroken chain: your ORC certificate
→ the Delft-series (DSYHS) physics run on that certificate → the analytic layer
→ the fleet’s 8 performance archetypes (the 2026 census) in
FleetEdge™ by SailrScience.
SailEdge computes the physics link — 850,000+ physics evaluations per Edge Map (one full aero and hydro force-balance solve at one point of the wind envelope),
anchored to the certificate polar — so the fleet’s answer starts on your certificate.
When the fleet view says what kind of boat you own, you can ask to see the work —
the work starts on this page. The physics presented here is SailEdge’s patent-pending
force physics; the portfolio’s IP story lives on the
SailrScience research page.